
WLTP range is the official standardized distance figure used for new EVs in the EU and UK, and it is a number many drivers may not reproduce in everyday driving. That is not necessarily because manufacturers misrepresent the figure. It comes from a standardized laboratory test cycle of about 30 minutes, performed on a chassis dynamometer under controlled conditions, rather than from a trip on a real road. For EVs, electric range and energy consumption are determined under the WLTP procedures set out in Commission Regulation (EU) 2017/1151.
The gap matters, since range affects how far you drive between charging stops and consumption affects how much electricity you pay for. In ADAC's 2026 winter motorway test of 14 cars rated at least 500 km WLTP, the best managed 441 km at 0 °C. WLTP electric consumption also accounts for energy drawn during recharging, including vehicle charging losses, making it more relevant to electricity costs than the car's dashboard consumption alone.
Knowing how the cycle is driven, why the US EPA often gives a lower number for the same car, and what a 20–80% charging habit does to usable range turns a headline figure into a planning tool. As a rough rule of thumb, multiply WLTP by 0.80–0.90 for mild mixed driving and allow for a larger reduction on a winter motorway journey.
What Is WLTP Range and How Is It Calculated?
In plain terms, WLTP range is the laboratory-derived distance a battery-electric car can cover on one full charge under the Worldwide Harmonised Light Vehicles Test Procedure. Treat it as a standardized benchmark between cars, not as a promise for your own commute.
The legal basis is Regulation (EU) 2017/1151, compulsory for new M1 vehicle types from 1 September 2017 and for new M1 vehicles from 1 September 2018 (Article 15). EU consumer-information rules then require official consumption and CO₂ figures to appear in specified point-of-sale and promotional materials, with WLTP values used for consumer information from 1 January 2019.
Annex XXI, Sub-Annex 8, paragraph 4.4.2.1.1 sets the calculation for pure electric range using the usable battery energy and electric energy consumption over the cycle. The required inputs are determined using either the consecutive cycle procedure (paragraph 3.4.4.1) or the shortened Type 1 test procedure (paragraph 3.4.4.2).
Take the Volkswagen ID.7 Pro S: 86 kWh usable from a 91 kWh gross battery, 16.2–13.6 kWh/100 km and up to 709 km WLTP (VW Newsroom, 4 June 2024). The roughly 5 kWh difference, about 5.5% of gross capacity, is unavailable as usable battery capacity.
The WLTP Test Cycle: Four Speed Phases at 23 °C
On a chassis dynamometer, the Class 3 WLTC lasts 1,800 seconds over 23.27 km, peaking at 131.3 km/h (about 82 mph) and averaging 46.5 km/h (JRC, "From NEDC to WLTP", 2017).
Green NCAP breaks it into four phases: Low 589 s, Medium 433 s, High 455 s and Extra High 323 s, with peaks of 56.5, 76.6, 97.4 and 131.3 km/h. Extra High fills only about 18% of cycle time, which helps explain why sustained motorway driving can diverge significantly from the WLTP figure.
The test cell is kept at 23 °C ± 5 °C, with heating and air conditioning switched off (Sub-Annex 6), and the test mass includes 25 kg plus 15% of the remaining maximum vehicle load (Annex XXI, 3.2.25–3.2.26). For battery-electric cars using the consecutive cycle procedure, cycles repeat until the vehicle exceeds the specified speed tolerance for 4 consecutive seconds (Sub-Annex 8, 3.4.4.1.3).

From Test Result to the Number on the Spec Sheet
The kWh/100 km figure on a WLTP spec sheet accounts for energy drawn from the mains during recharging, not just energy discharged from the battery. Sub-Annex 8, paragraph 3.4.4.3.2 places the energy-measuring equipment between the mains and the vehicle, and paragraph 4.3.4.2 calculates electric energy consumption using the recharged energy and the applicable range. The official figure therefore includes charging losses between the mains and the battery, which can make a dashboard consumption readout lower than the WLTP consumption figure.
The ID.7 Pro S illustrates the relationship: 13.6 kWh/100 km × 7.09 = about 96 kWh of WLTP energy consumption over 709 km, against 86 kWh usable battery capacity. That is roughly 12% more energy than the battery's usable capacity.
That mains-side measurement can be used to estimate charging cost directly. An unqualified "WLTP range" generally refers to the combined figure; the separate city figure is covered further down.
WLTP Range vs Real-World Range: How Accurate Is It?
Real-world EV range can land 10–30% below the WLTP figure in mixed driving, with larger gaps possible on cold motorways. Some makers, Polestar among them, also provide range estimates that account for driving conditions alongside the WLTP figure, reflecting how much actual range can vary from the official number.
ADAC's laboratory tests confirm the gap: the Tesla Model Y consumed 16.4 kWh/100 km against a WLTP figure of 13.1, and the Hyundai Ioniq 6 17.0 vs 13.5, roughly 23% higher across a six-car sample. ADAC's Ecotest also includes a motorway cycle at up to 130 km/h and counts charging losses, which can widen the difference from WLTP.
In ADAC's January 2026 winter test, 14 EVs rated at 500 km WLTP or more ran at 0 °C on a simulated motorway route with speeds of up to 130 km/h. The best, an Audi A6 Avant e-tron, managed 441 km, about 61% of its 719 km WLTP figure, while the BYD Sealion 7 fell below 300 km. Green NCAP (November 2025) similarly estimated the Hyundai Inster at 322 km in warm mixed use but 199 km on a cold motorway; pre-warming a VW ID.4 added 46 km in cold mixed driving, partly why driving an EV in winter rewards preparation.
Range-reducing factors include:
- Sustained high motorway speeds
- Ambient temperatures near or below 0 °C
- Cabin heating, particularly without a heat pump
- Roof boxes, heavy loads, under-inflated tyres and larger wheels
- Battery degradation over time
|
Conditions |
Approximate range |
|
Mixed driving, mild weather |
About 0.80–0.90 × WLTP |
|
Winter motorway |
Often below 0.75 × WLTP, with substantial variation by vehicle and conditions |
Plan trips using a conservative estimate. The EU's OBFCM gap report (COM(2024) 122) does not provide a WLTP-to-real-world comparison for pure electric cars, so it cannot provide an official WLTP-to-real-world figure for BEVs.
WLTP Range vs NEDC, EPA and CLTC: Which Rating Is Most Realistic?
For a European driver, WLTP is more representative of real-world driving conditions than the old NEDC, while China's CLTC uses a different test cycle. US EPA figures often come out lower for the same car because EPA range values are adjusted to account for real-world factors not represented in the laboratory tests. None of the four guarantees real-world range.
|
Standard |
Region |
Test style |
Relationship to real world |
Reading it against WLTP |
|
NEDC |
EU, pre-WLTP |
Shorter, lower-speed cycle |
Generally optimistic |
Generally higher than WLTP |
|
WLTP |
EU/UK |
30-min four-phase lab cycle |
Standardized benchmark |
Reference figure |
|
EPA |
USA |
City and highway testing with real-world adjustments |
Designed to account for additional real-world factors |
Often below WLTP |
|
CLTC |
China |
Three-phase, lower-average-speed cycle |
Different driving profile |
Often higher than WLTP for EVs |

WLTP vs NEDC
NEDC, a cycle covering 11.03 km in 1,180 seconds with lower average speeds and less dynamic driving than WLTP (JRC, From NEDC to WLTP), generally produced higher electric-range figures than WLTP. Pre-WLTP range figures are therefore not directly comparable with current WLTP figures.
WLTP's longer, faster, more dynamic cycle and defined test mass make it more representative of real-world driving than NEDC, and Regulation (EU) 2017/1151 introduced WLTP to provide more realistic test conditions and results.
WLTP vs EPA
The US EPA tests EVs on a dynamometer using city and highway driving cycles, with manufacturers able to use different approved test procedures, then adjusts the resulting range to better reflect real-world driving, most commonly by a factor of 0.7 (EPA, "Fuel Economy and EV Range Testing").
WLTP, by contrast, does not apply an EPA-style blanket derating to the laboratory-derived range. EPA range figures consequently often come out lower than WLTP figures for the same vehicle, although the gap varies by model.
WLTP vs CLTC
The China Light-duty Vehicle Test Cycle uses a lower average speed than the WLTC, so CLTC range figures published for the Chinese market can be higher than WLTP figures for comparable vehicles.
Buyers of models such as the BYD Atto 2 or Atto 3 should check which test standard a quoted range uses: European specifications use WLTP figures, while figures from other markets may use different test standards.
The 80% Rule: Why Your Usable Range Is Less Than the WLTP Figure
The 80% rule is a common recommendation for everyday charging of many EVs with NMC lithium-ion batteries, with some manufacturers recommending an everyday charge limit of about 80% state of charge. Drivers may also choose not to run the battery much below roughly 20%, leaving a practical 20–80% band.
High state of charge can accelerate cell ageing, and DC fast charging generally slows at higher states of charge. Drivers who routinely stay within a 20–80% window use about 60% of the battery's usable capacity, on top of the buffer already reserved by the manufacturer (the ID.7 Pro S's 91 kWh gross vs 86 kWh usable).
The arithmetic is straightforward.
A Renault Zoe with a 395 km WLTP range, driven from 80% to 20%, covers roughly 237 km on paper, and potentially less in real-world conditions. That is the more useful trip-planning number, not the headline figure.
However, the shorter 20–80% range matters less when you can charge at home overnight. Regular home charging can restore the battery to your chosen charge limit each day; check how long charging takes to see how overnight charging fits into daily use.
WLTP Combined vs WLTP City Range: Reading a Spec Sheet Correctly
"WLTP City" is a separately calculated official figure: Sub-Annex 8, paragraph 4.4.2.1.2 calculates pure electric city range from the shortened Type 1 test procedure using the applicable WLTP city-cycle energy consumption, rather than from a separate city-only drive. Because the city calculation uses the lower-speed parts of the WLTC, the city range is generally higher than the combined figure.
|
Model (WLTP) |
Battery |
Combined |
City |
kWh/100 km |
|
Volvo EX30 P5 Electric |
51 kWh |
337 km |
441 km |
17.1 |
|
Volvo EX30 P5 Long Range |
69 kWh |
475 km |
659 km |
17.0 |
|
Volvo EX30 P8 AWD |
69 kWh |
449 km |
591 km |
17.5 |
|
VW ID.7 Pro S |
86 kWh usable |
up to 709 km |
– |
16.2–13.6 |
Source: Volvo Cars Ireland EX30 specifications; VW Newsroom.
On the EX30 Long Range, the city figure is about 39% (184 km) higher than the WLTP combined range on the same car.
Trim matters too. The P5 Long Range and P8 AWD share a 69 kWh battery yet differ by 26 km in combined WLTP range, with differences in drivetrain and specification affecting consumption. Buyers of a Tesla Model 3, Kia EV6, Hyundai Ioniq 5, VW ID.4 or BYD Atto 3 should confirm the exact variant and check that the quoted range is the combined WLTP figure before estimating real-world range.
Using the WLTP Figure to Estimate Your Real Charging Cost
Because WLTP consumption accounts for energy drawn from the mains during recharging, WLTP kWh/100 km × distance × your tariff gives a useful baseline electricity-cost estimate; real-world consumption can be higher, as the ADAC results above show.
ADAC also lists the energy required for a full charge in its test:
|
Model (ADAC test) |
kWh usable |
kWh per full charge |
|
Hyundai Ioniq 6 84 kWh |
84.0 |
90.4 kWh |
|
Mercedes CLA 350 EQ |
85.0 |
99.4 kWh |
At an illustrative €0.30/kWh home tariff, a full Ioniq 6 charge costs about €27, roughly €5.10 per 100 km over its 532 km measured range. The CLA, drawing about 17% more energy per full charge than its usable battery capacity, costs about €4.44 per 100 km over its 672 km measured range.
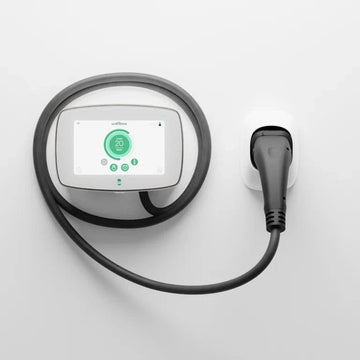
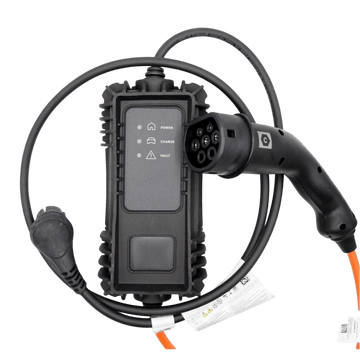
Charging point changes the loss. ADAC measured charging losses of about 13–24% on a household socket versus about 5–7% with a wallbox in its latest test, as slower charging keeps the car's electronics powered for longer.
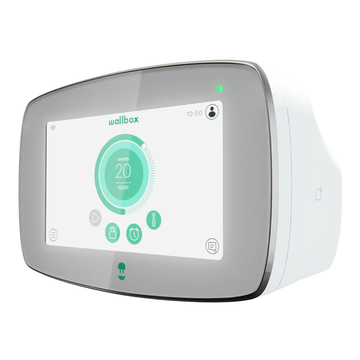
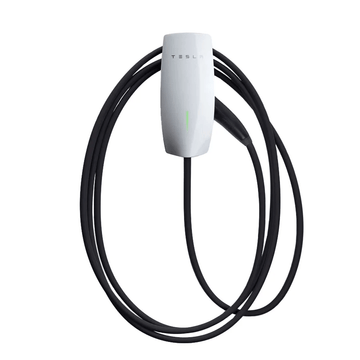
A dedicated wallbox can thus cut per-kilometre charging cost versus a granny cable; weigh it against installation costs. EVChargers.eu, run by Julius, an EV driver since 2018, answers pre-sale questions personally. Still on a domestic plug? See charging from a 13 A socket.

WLTP Range: FAQ
What does WLTP stand for, and what does WLTP range mean?
WLTP stands for Worldwide Harmonised Light Vehicle Test Procedure. WLTP electric range is the type-approval distance a battery-electric car can cover on one full charge under the standardized test procedure. It is a comparison benchmark between cars, not a real-world promise.
How do I convert WLTP range to real-world range?
As a rough rule of thumb, multiply the WLTP figure by 0.80–0.90 for mixed driving in mild weather and allow for a larger reduction on a winter motorway journey. In ADAC's 0 °C motorway test, the best of 14 cars rated at least 500 km WLTP reached only 441 km.
Which is better, NEDC or WLTP?
WLTP is more representative of real-world driving conditions. Its Class 3 cycle lasts 30 minutes, covers 23.27 km and reaches 131.3 km/h, compared with the 1,180-second, 11.03 km NEDC. NEDC generally produced higher electric-range figures, so older NEDC and current WLTP figures should not be compared directly.
Why are manufacturers allowed to advertise WLTP range if cars rarely reach it?
WLTP provides a standardized type-approval figure for comparing cars. Regulation (EU) 2017/1151 defines the WLTP test procedures used to determine electric range and energy consumption. A manufacturer quoting the official WLTP range is therefore using a standardized test result, not promising that every driver will achieve that range.
Standardized laboratory conditions make brands comparable but can differ substantially from winter motorway driving. When a manufacturer also provides a real-world range estimate, use it as an additional planning reference rather than a guaranteed figure.
WLTP range is a laboratory figure determined under standardized conditions, so treat it as a comparison benchmark rather than a ceiling. The declared kWh/100 km accounts for energy drawn during recharging, including charging losses, making it more relevant to running costs than the car's dashboard consumption alone. ADAC measured charging losses of about 13–24% on a household socket versus 5–7% with a wallbox in its latest test, making a dedicated wallbox more energy-efficient than a household socket for home charging.
At EVChargers.eu, Julius, a daily EV driver whose EV journey began in 2018, offers charging hardware selected for the store. To close the gap between what the spec sheet promises and what you pay per kilometre, browse the home wallbox range from 7 kW to 22 kW, with EU shipping currently offered free.